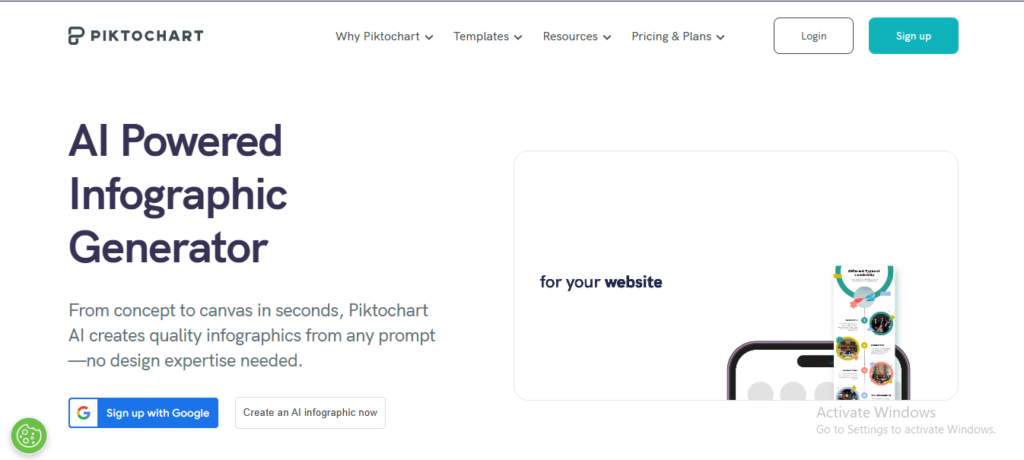
Piktochart AI: Create Stunning Visuals in Seconds
Piktochart AI is a revolutionary design tool that leverages artificial intelligence to transform text or data into stunning visuals.
Description
Piktochart AI is a revolutionary design tool that leverages artificial intelligence to transform text or data into stunning visuals. This innovative platform empowers users to create infographics, presentations, reports, and other visual content with unprecedented ease and speed. With Piktochart AI, anyone can become a visual storyteller, regardless of their design experience.
Unique Features and Benefits:
- AI-powered visual generation: Transform text or data into engaging visuals with a simple prompt.
- Diverse templates and formats: Choose from a wide variety of templates for infographics, presentations, reports, and more.
- Customizable designs: Tailor generated visuals to match your brand and style preferences.
- Intelligent design assistance: Receive AI-powered suggestions for layout, color schemes, and font pairings.
- Time-saving efficiency: Create professional-quality visuals in a fraction of the time compared to traditional methods.
How Piktochart AI Works:
- Input your content: Provide text, data, or a simple prompt describing your desired visual.
- AI generates the design: Piktochart AI's algorithms create a visually appealing design based on your input.
- Customize and refine: Adjust colors, fonts, images, and layout elements to personalize your visual.
- Add interactive elements: Incorporate charts, maps, videos, and other interactive elements to enhance engagement.
- Download and share: Export your finished visual in various formats for online sharing or printing.
Key Features and Functionalities:
- AI-powered visual generation from text and data
- Diverse templates for various content formats
- Customizable design elements and styles
- Intelligent design assistance with AI suggestions
- Interactive elements for enhanced engagement
- User-friendly interface with drag-and-drop functionality
Use Cases and Examples:
Use Cases:
- Creating infographics for social media or blog posts
- Designing presentations for business meetings or educational purposes
- Generating reports with visually appealing data visualizations
- Developing visual content for marketing campaigns
- Creating posters and flyers for events or promotions
Examples:
- A marketing team uses Piktochart AI to create an infographic summarizing their latest campaign results.
- A teacher utilizes Piktochart AI to design an engaging presentation for their students.
User Experience:
While Piktochart AI focuses on AI-powered visual generation, its design and features suggest a user experience that prioritizes:
- Simplicity: The intuitive interface and AI assistance make design accessible to everyone.
- Speed: The platform generates visuals quickly, allowing for rapid iteration and exploration.
- Creativity: The diverse templates and customization options empower users to create unique and engaging visuals.
Pricing and Plans:
Piktochart offers a free plan with basic features and premium plans with advanced functionalities and higher usage limits.
Competitors:
- Canva: A popular graphic design platform with a wide range of templates and design tools.
- Visme: A visual content creation tool with a focus on interactive and animated visuals.
- Venngage: An infographic maker with a drag-and-drop interface and customizable templates.
Unique Selling Points:
- AI-powered visual generation from text and data inputs
- Intelligent design assistance with AI-powered suggestions
- Diverse templates and formats for various content needs
Last Words: Unleash your creativity and communicate effectively with Piktochart AI. Visit their website today and experience the power of AI-powered visual design.
